NOTICE
We use cookies to improve the user experience and analyze its performance.
A power monitor turns invisible electrical behavior into information that people can understand and act upon. It measures voltage, current, frequency, power factor, energy use, and sometimes harmonic distortion. In a factory, this may mean observing a motor start, a sudden voltage drop, or an overloaded circuit. In a home, it may reveal how much electricity an air conditioner consumes during a hot afternoon.
Dr. Surya Santoso, a recognized power-quality researcher, wrote, “Power quality is the concept of powering and grounding sensitive equipment in a manner that is suitable to the operation of that equipment.” His statement explains why monitoring matters. A stable voltage reading does not always mean a healthy electrical system. Short disturbances may damage sensitive equipment without appearing on a basic display.
Inside a power monitor, sensors detect electrical signals at carefully selected points. A processor samples those signals and calculates usable values. The device may then show live readings, store trends, or send alerts when conditions exceed set limits. Some advanced models connect with building-management systems or cloud dashboards. Useful evidence appears as a timeline, not only a single number.
Still, monitoring is not magic. Incorrect wiring, poor sensor placement, or unsuitable settings can produce misleading results. I have found that real troubleshooting often begins with checking the installation itself. The screen may be accurate, yet the conclusion may be wrong. That small distinction deserves attention throughout this guide.
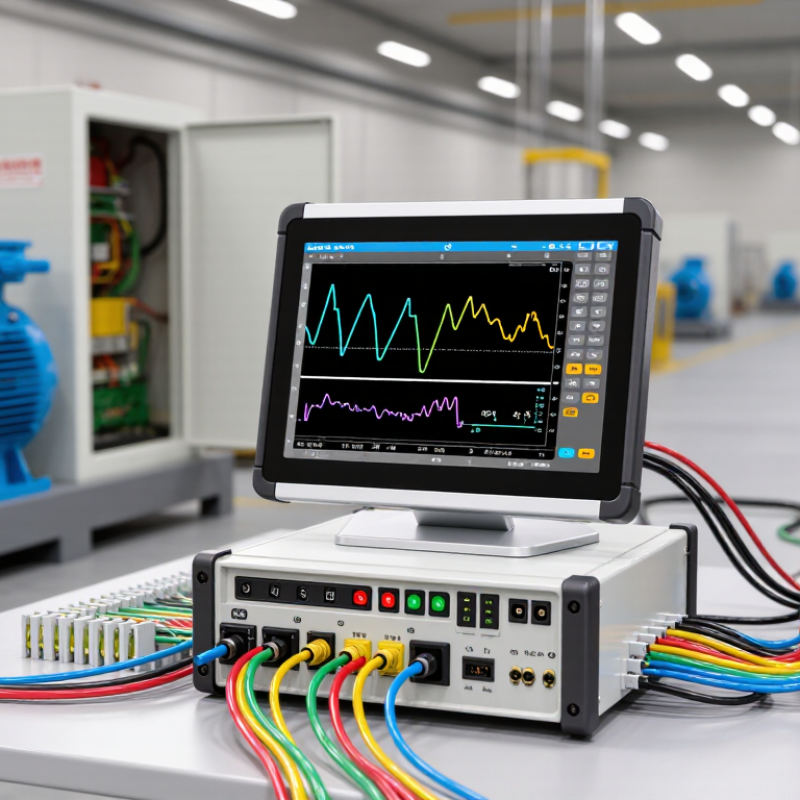
A power monitor measures how electricity behaves inside a circuit. Voltage shows the electrical pressure between two points. Current shows the flow through a conductor. Most monitors sample both values many times per second, using sensors and a processing circuit. The readings can reveal overloads, unstable supply, or equipment that quietly wastes energy.
Real power is measured in watts and represents useful electrical work. Apparent power combines voltage and current, while power factor compares real power with apparent power. A low power factor can make wiring carry more current than expected. That increases losses and may reduce available capacity. The monitor calculates these values from voltage and current waveforms, not from a single quick reading. Waveform distortion can complicate the result.
Energy is measured in watt-hours or kilowatt-hours. The monitor adds power readings across time, like filling a digital measuring cup. A 1,000-watt load running for one hour uses about 1 kilowatt-hour. Installation matters greatly. Incorrect sensor direction, loose connections, or poor calibration can produce convincing but wrong data. Small errors matter. In practice, I would compare the monitor with a trusted reference meter and inspect unusual readings before changing equipment. Even then, no measurement is perfect, especially when motors start, loads switch rapidly, or voltage changes suddenly.
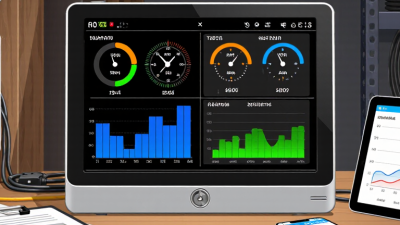
A power monitor turns invisible electrical flow into readable evidence. Current transformers, or CTs, clamp around a conductor without opening the circuit. Their magnetic core follows the changing current and produces a smaller secondary signal. CTs are practical for large feeders, but saturation can distort readings during faults or heavy inrush.
A shunt takes a different route. It places a precisely known resistance in series with the load. The monitor measures the tiny voltage drop, then calculates current using Ohm’s law. Shunts offer strong low-current accuracy, though they create heat and require careful installation. Potential transformers, or PTs, reduce high voltage to a safer measurement level. IEC 61869-2 and IEC 61869-3 define important requirements for instrument transformers. Real installations still need verification. Wiring mistakes happen.
The monitor samples these signals many times each cycle. It calculates RMS voltage, RMS current, power factor, and real power from waveform timing. A 50 Hz system completes fifty cycles each second; a 60 Hz system completes sixty. Harmonics can complicate that neat picture. The International Energy Agency’s Electricity 2024 report estimated data centres consumed about 460 TWh globally in 2022, with demand potentially exceeding 1,000 TWh by 2026. Accurate sensing therefore matters beyond the display. A loose CT connection, incorrect PT ratio, or poor sampling rate can produce confident but wrong numbers. I always compare readings against a calibrated reference and inspect the waveform, not only the final kilowatt value.
| Measurement Dimension | Sensor or Processing Method | How It Works | Primary Output | Important Characteristics |
|---|---|---|---|---|
| AC current | Current transformer (CT) | The conductor acts as a primary winding. The alternating magnetic field induces a smaller proportional current in the secondary winding. | Scaled secondary current or voltage signal | Provides galvanic isolation and is well suited to high-current AC circuits. The secondary should not be left open-circuited while the primary carries current. |
| AC or DC current | Precision shunt resistor | A known low resistance produces a measurable voltage according to V = I × R. | Millivolt-level voltage proportional to current | Supports DC measurement and high bandwidth, but introduces power loss and does not inherently isolate the measurement circuit from the conductor. |
| AC or DC current | Hall-effect current sensor | A magnetic field generated by the conductor is detected by a Hall element. Closed-loop versions use feedback to improve linearity. | Analog voltage or digital current value | Can measure both AC and DC while maintaining electrical isolation; offset, temperature drift, and bandwidth require calibration or compensation. |
| AC voltage | Potential transformer (PT) or voltage transformer (VT) | A transformer reduces a high AC voltage to a lower, proportional voltage for safe measurement. | Scaled low-voltage AC signal | Provides isolation and voltage scaling. The ratio, burden, frequency response, and phase error affect measurement accuracy. |
| AC voltage | Resistive voltage divider | A network of precisely selected resistors reduces the input voltage by a known ratio. | Low-voltage analog signal | Compact and suitable for many low- and medium-voltage measurement designs, but isolation, resistor heating, and safety clearances must be addressed. |
| Frequency | Zero-crossing detection or digital waveform analysis | The monitor measures the time between repeating waveform features or calculates frequency from sampled voltage and current data. | Hertz (Hz) | Nominal power-system frequencies are commonly 50 Hz or 60 Hz. Distortion and noise can affect simple zero-crossing methods. |
| RMS current and voltage | Analog-to-digital conversion and numerical calculation | The monitor squares sampled values, averages them over a measurement window, and calculates the square root: XRMS = √(Σx² / N). | Amperes RMS and volts RMS | True-RMS processing measures nonsinusoidal waveforms more accurately than methods based only on the average value of a rectified waveform. |
| Active power | Synchronized voltage and current sampling | Instantaneous voltage and current values are multiplied and averaged: P = average(v × i). | Watts (W) or kilowatts (kW) | Voltage-current channel timing and phase accuracy are essential, especially when the load has a low power factor. |
| Reactive and apparent power | Phase-angle analysis of voltage and current | The monitor determines the phase relationship and combines it with RMS voltage and current. | VAR, kVAR, VA, or kVA | For sinusoidal conditions, apparent power is S = VRMS × IRMS, and power factor is PF = P / S. |
| Energy consumption | Time integration of active power | The monitor accumulates active power over time: E = ∫P(t)dt. | Watt-hours (Wh) or kilowatt-hours (kWh) | Measurement accuracy depends on sensor ratio, phase error, ADC resolution, sampling synchronization, and calibration. |
| Sampling and signal quality | ADC, anti-aliasing filter, and digital signal processing | Analog sensor outputs are filtered and converted into digital samples. The processor then calculates electrical quantities and may detect harmonics or transients. | Digital measurements and waveform data | The sampling rate must exceed twice the highest frequency of interest to satisfy the Nyquist requirement; practical systems use additional margin and filtering. |
A power monitor measures voltage and current continuously or at timed intervals. It then estimates how much electrical power a circuit uses. For real-time power, the practical equation is P = V × I × Power Factor . Voltage is measured in volts, while current is measured in amperes. The power factor shows how effectively the load converts electrical energy into useful work.
A heater may have a power factor close to 1. Motors and switch-mode equipment can behave differently. Their current may lag or distort the voltage waveform. A monitor therefore samples both waveforms, rather than multiplying two occasional readings. This matters during startup, when current can briefly rise several times above its normal level. The display can change quickly.
The International Energy Agency reported that global electricity demand grew by 2.2% in 2023. Its Electricity 2024 report projected average annual growth of 3.4% from 2024 to 2026. Small measurement errors can become expensive across large facilities. IEC 61557-12 also addresses performance requirements for power monitoring devices.
Still, a neat screen does not guarantee accurate data. Sensor placement, phase wiring, waveform distortion, and calibration all affect the result. This is where real installations become imperfect. A monitor may report low power while a loose connection, incorrect phase angle, or unsuitable sensor quietly corrupts the reading. Checking wiring and comparing readings with a calibrated reference remains essential.
A power monitor measures voltage and current, then calculates power, energy, frequency, and power quality. Its sensors capture waveforms several times per cycle. The device converts those readings into values operators can review on a display or energy system. Small errors matter. A 1% reading error can distort cost allocation, especially in a large facility.
IEC 61557-12 defines performance requirements for power monitoring devices used in low-voltage systems. It addresses measurement uncertainty, operating conditions, response behavior, and functional testing. It is not the same as an energy-meter accuracy class. Class 0.5S metering normally refers to active-energy meters tested under IEC 62053-22. The “0.5” class indicates tighter permitted error than many general-purpose meters, while actual limits depend on current, power factor, temperature, and frequency.
The International Energy Agency’s Electricity 2024 report recorded 2.2% global electricity-demand growth in 2023. It forecasts average annual growth of 3.4% from 2024 to 2026. More demand increases the value of dependable measurement. Yet, this is not a magic number. Installation quality often decides real accuracy. Incorrect phase sequence, loose terminals, or unsuitable current transformers can undermine a certified device. Technicians should verify polarity, burden, grounding, and calibration records. Results should be traceable to recognized national measurement standards. A brief field check may reveal drift that a dashboard hides. That deserves attention.
The chart compares nominal active-energy error limits commonly associated with metering accuracy classes under reference test conditions. A Class 0.5S meter is designed for tighter accuracy than Class 1 and Class 2 devices. IEC 61557-12 evaluates power-monitoring equipment across functions such as voltage, current, power, energy, frequency, and power quality; the exact uncertainty depends on the measured quantity, operating range, environmental conditions, and test method.
A power monitor measures voltage, current, power factor, energy use, and demand. Sensors collect readings from a panel or machine. The monitor then processes these signals at regular intervals. On a production floor, this can reveal a motor drawing excessive current before failure becomes obvious.
Communication determines how useful those readings become. Modbus commonly transfers register values between the monitor and a control system. Ethernet supports faster access through a local network and may connect several meters across a facility.
Alarms can identify overloads, voltage loss, abnormal demand, or communication failures. A practical setup should record the alarm time, measured value, and response. Otherwise, an alarm may flash briefly and leave little evidence.
Data can also support ISO 50001 energy reviews when timestamps, measurement boundaries, and calibration records remain consistent. Reliable records matter more than attractive dashboards.
Tips: Confirm the wiring before trusting the readings. Compare one channel with a calibrated reference meter. Use clear alarm limits, and review them after seasonal load changes. Keep a simple register map for Modbus points. Ethernet settings should be documented securely. I have seen teams collect plenty of data but miss the real issue: inconsistent timestamps. A small gap can weaken an otherwise careful energy analysis.